Research
Quick Links and FAQ's
- Multi-Sports Facility Comparison
- Tennis Facility Comparison
- Soccer Facility Comparison
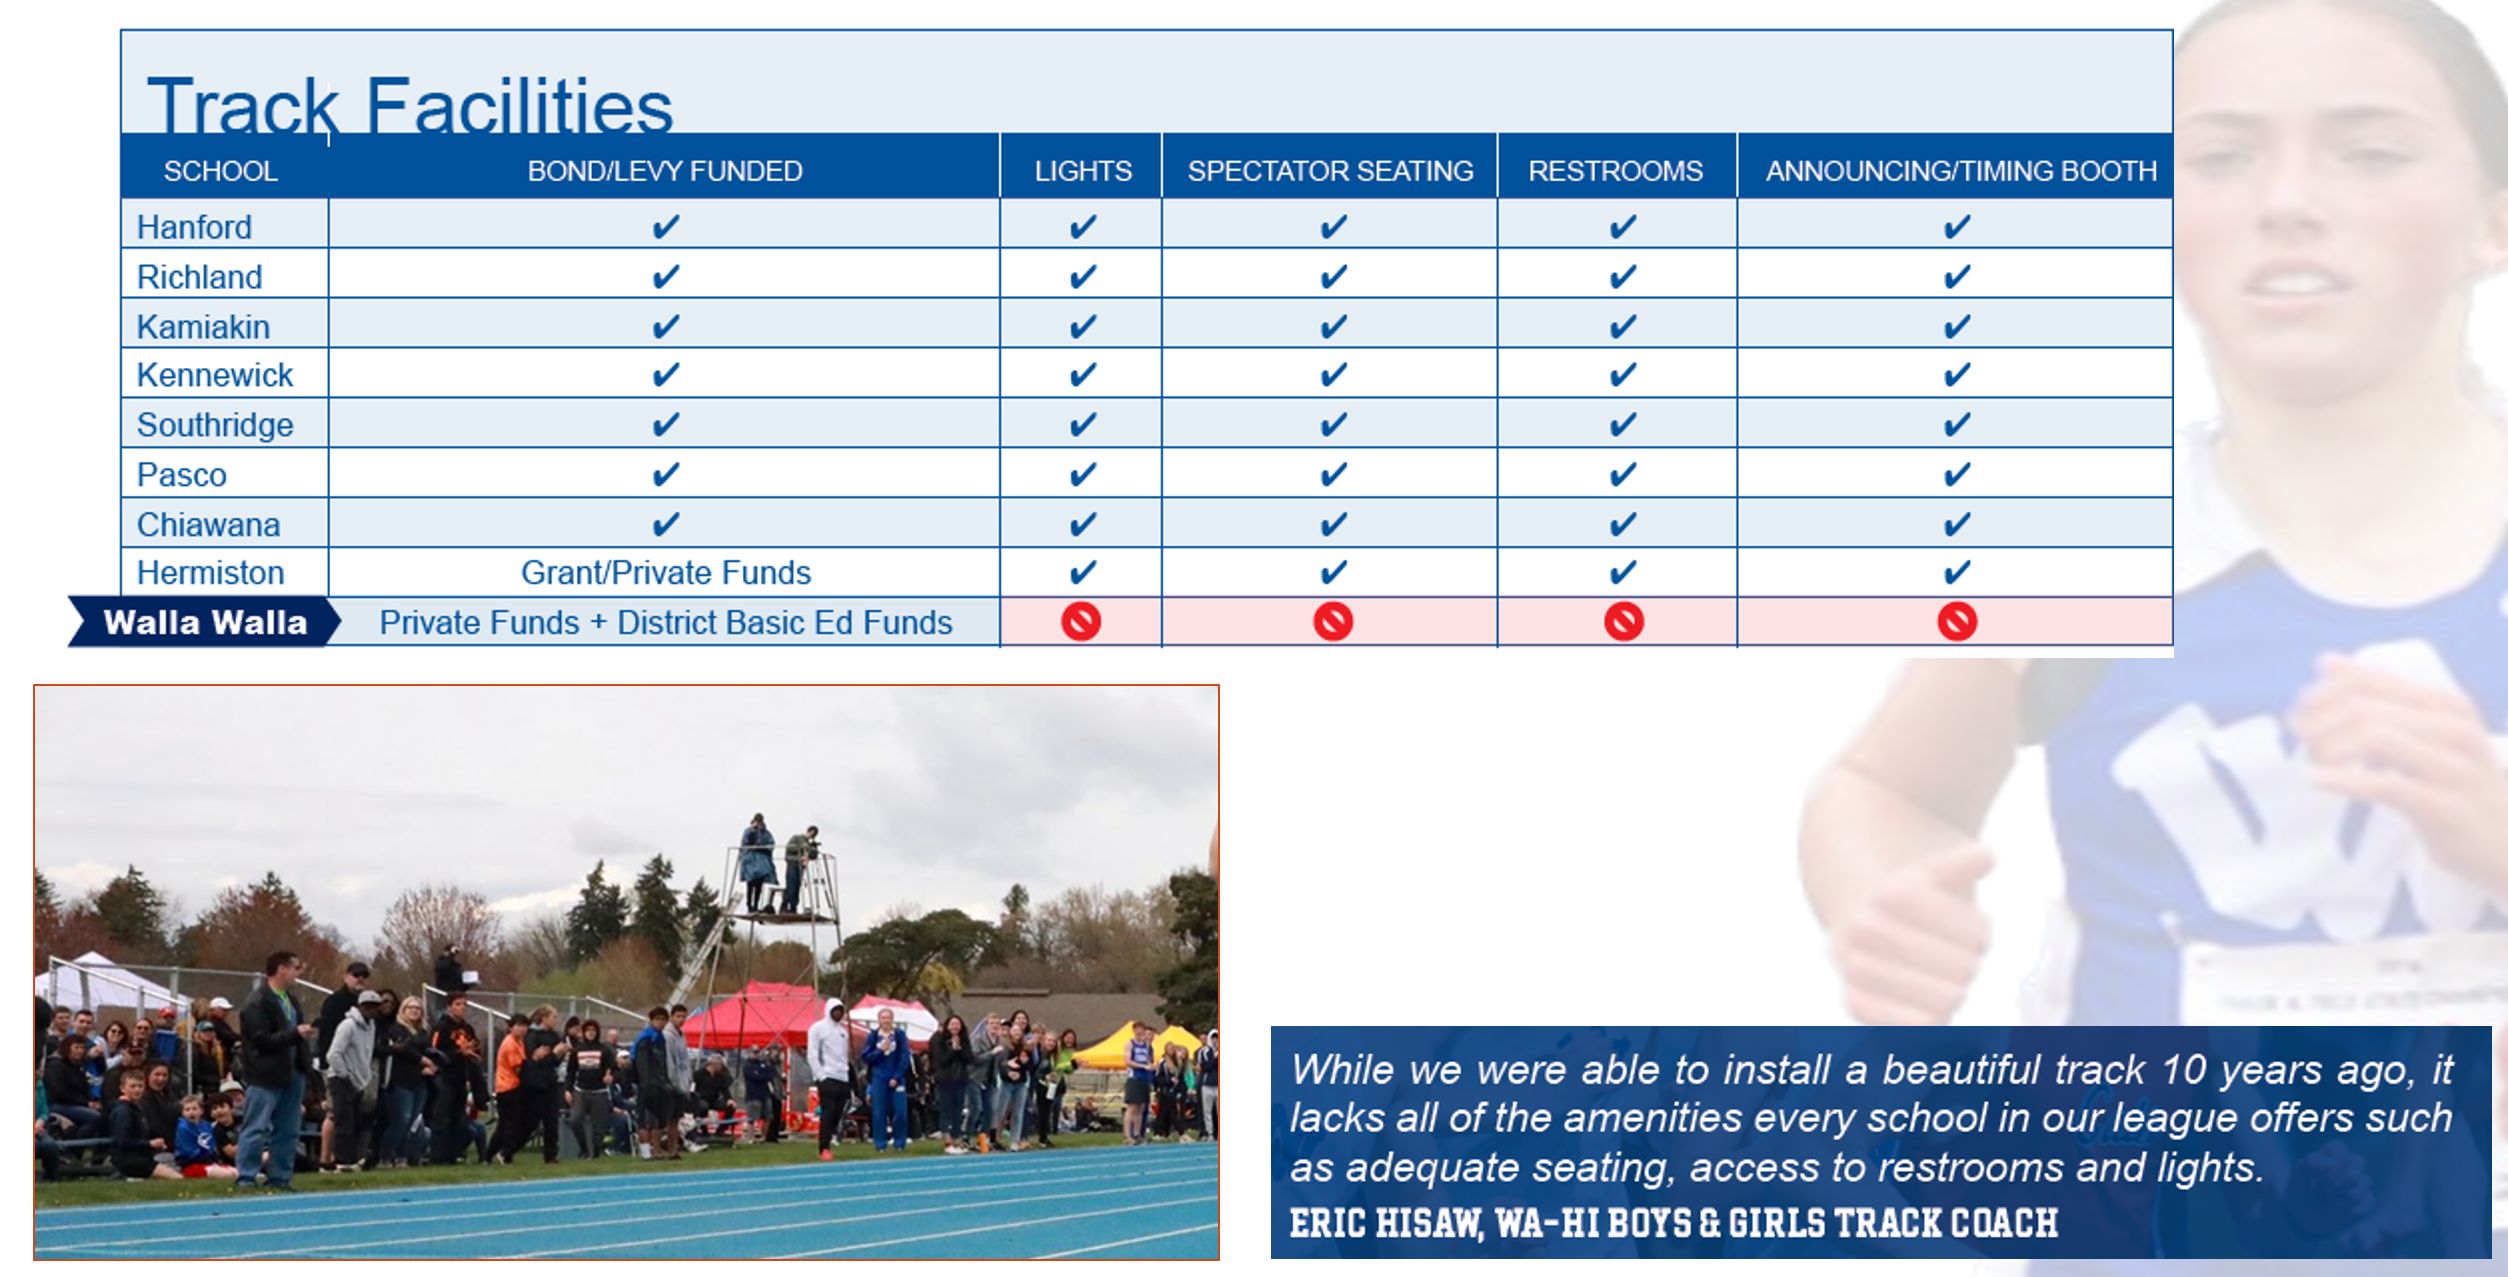
- Track Facility Comparison
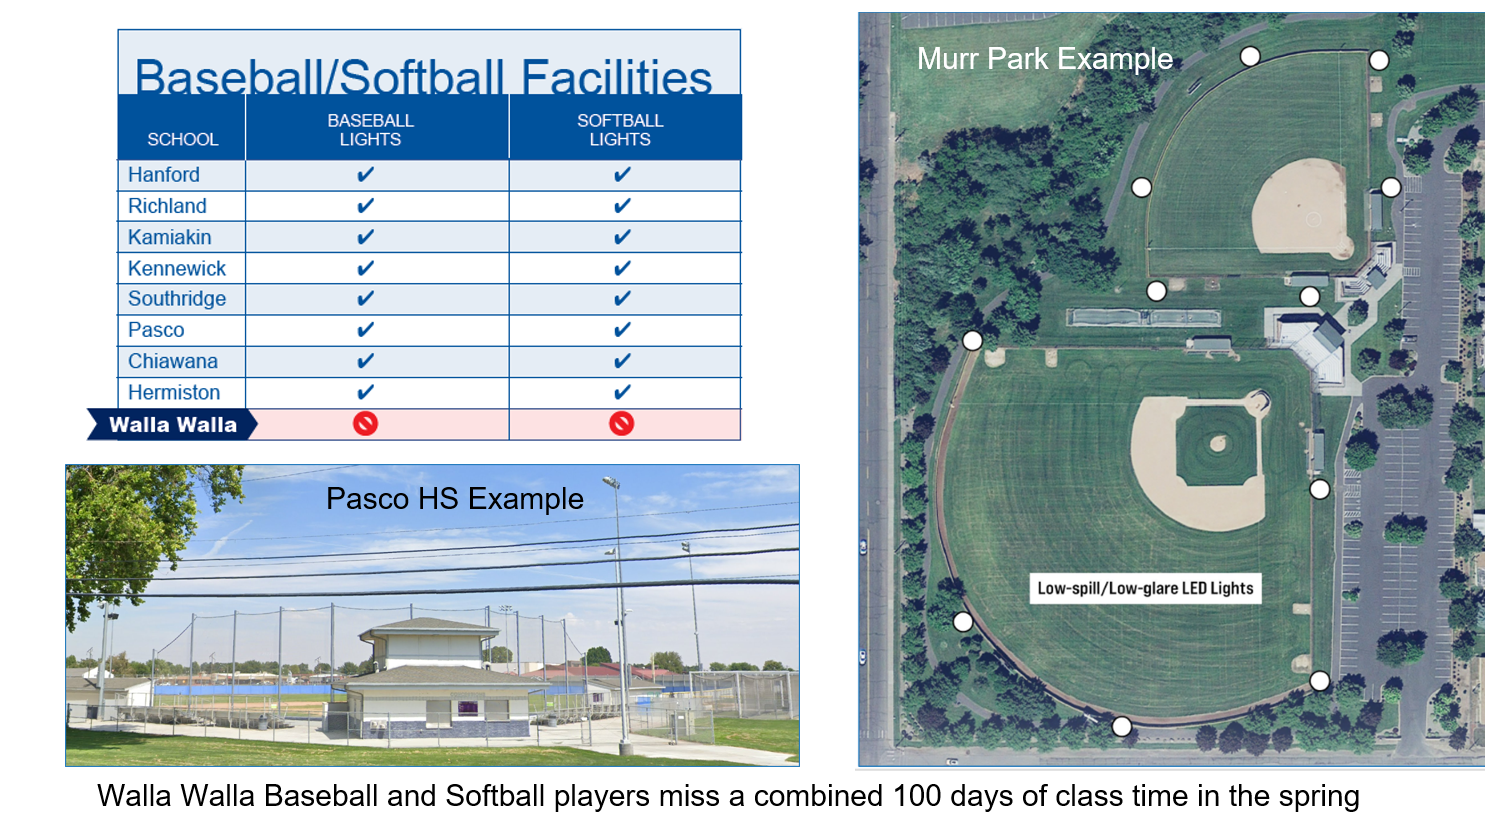
- Baseball/Softball Light Comparison
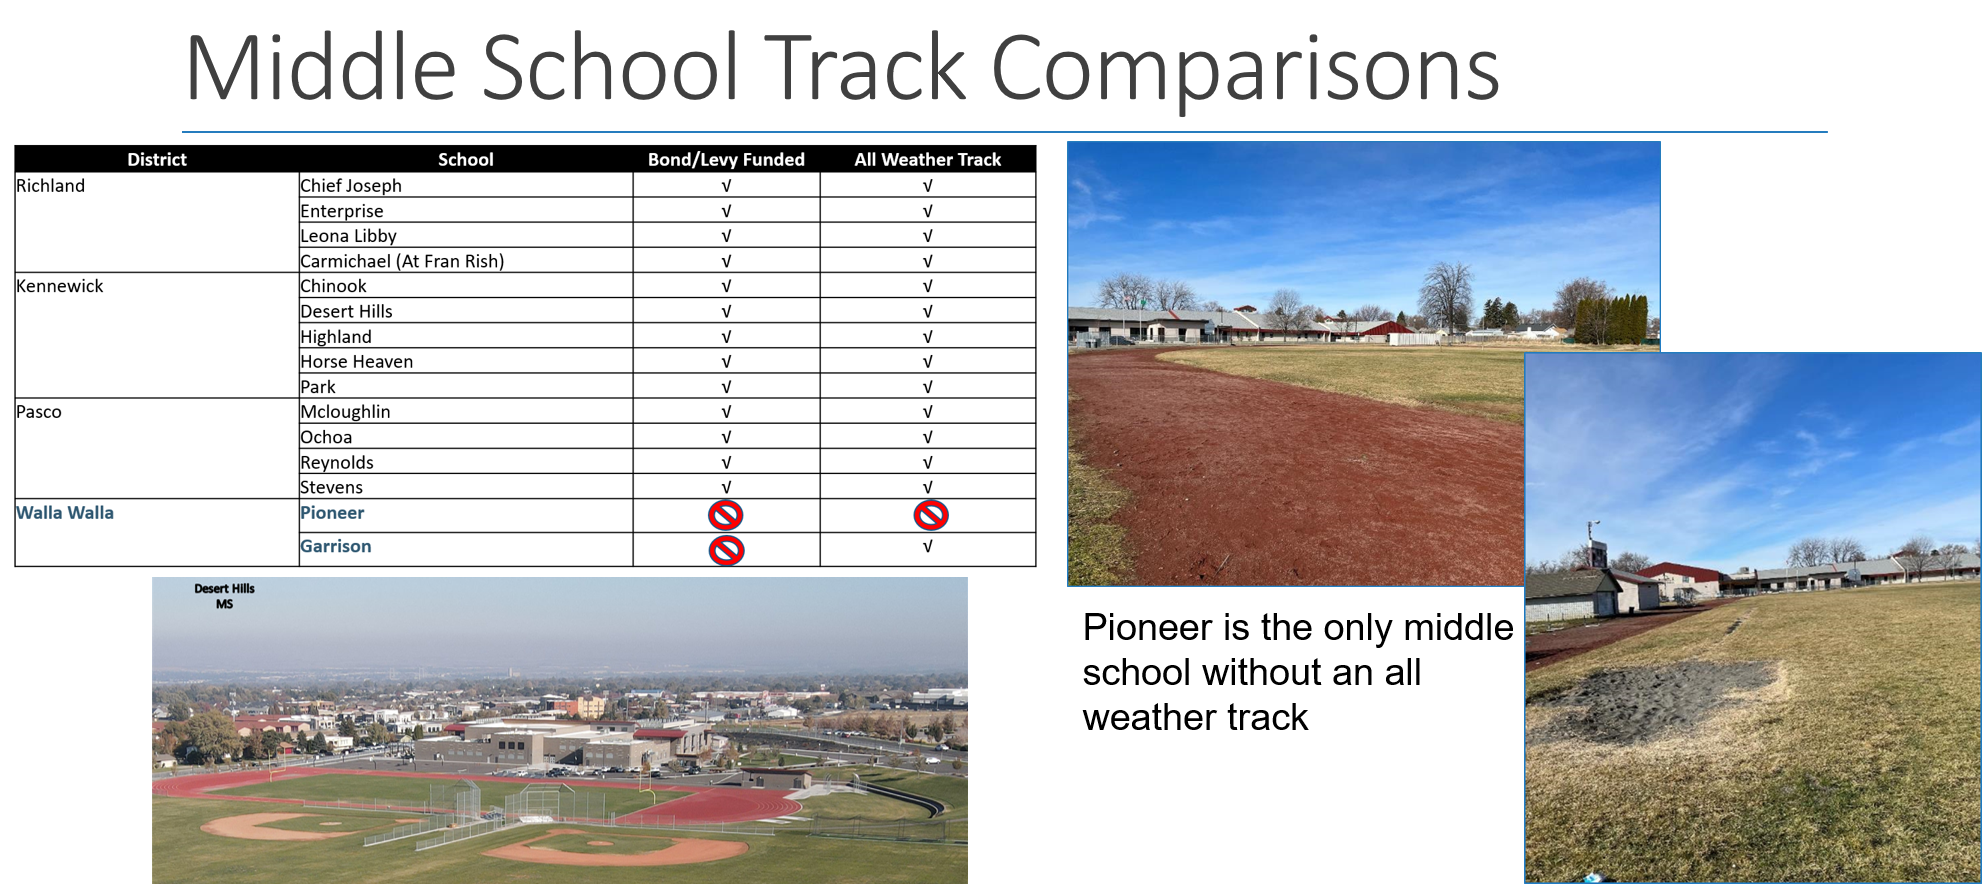
- Middle School Track Comparison
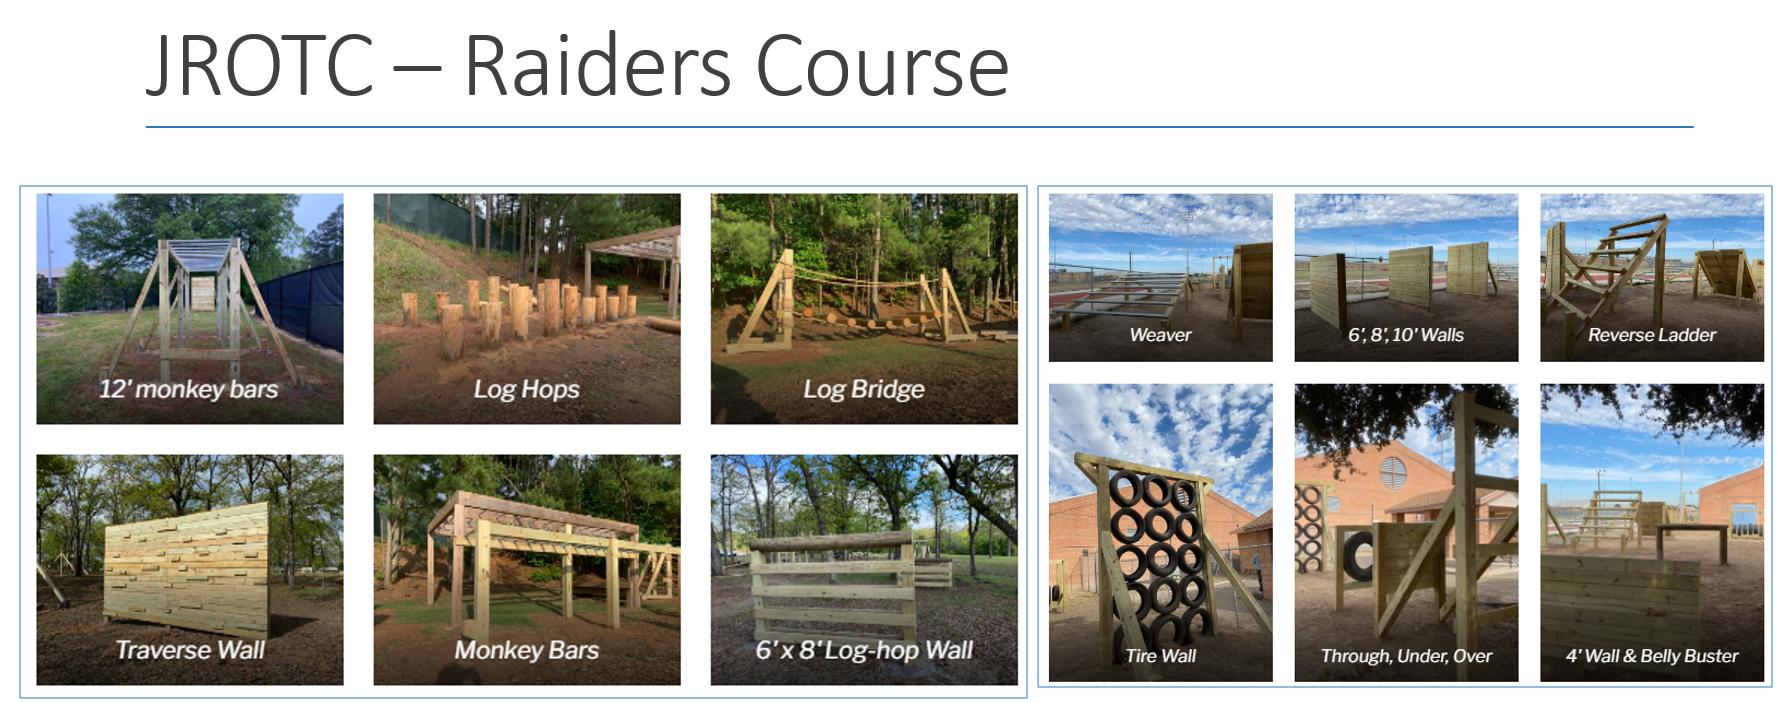
- JROTC Raider Course
- What Has Our historical Bond/capital Rate Been?
- How Much Will This Cost?
- Transitioning Away From Borleske
- Is There Sufficient Parking and What About Traffic?
- Low-spill/low-glare Field Light Technology
- Economic Impact to Local Businesses
- Preliminary Coach and Parent Report
- Safety of New Generation Turf
- Is Artificial Turf Cost Effective?
- Forever Chemicals
Facility Comparison Report
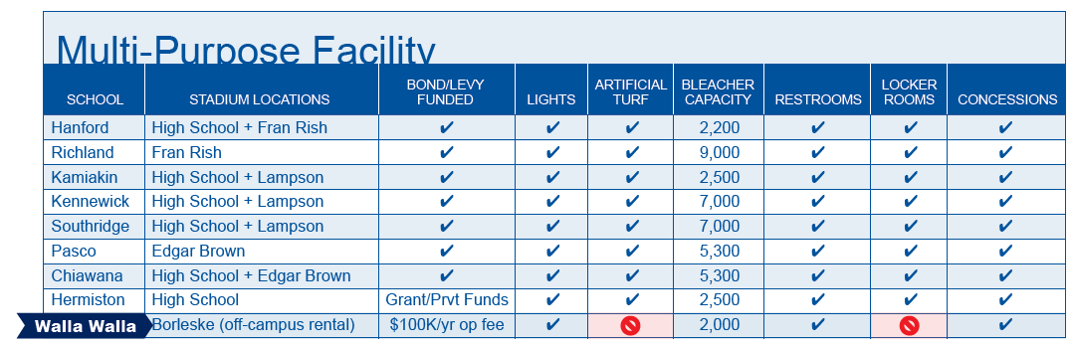
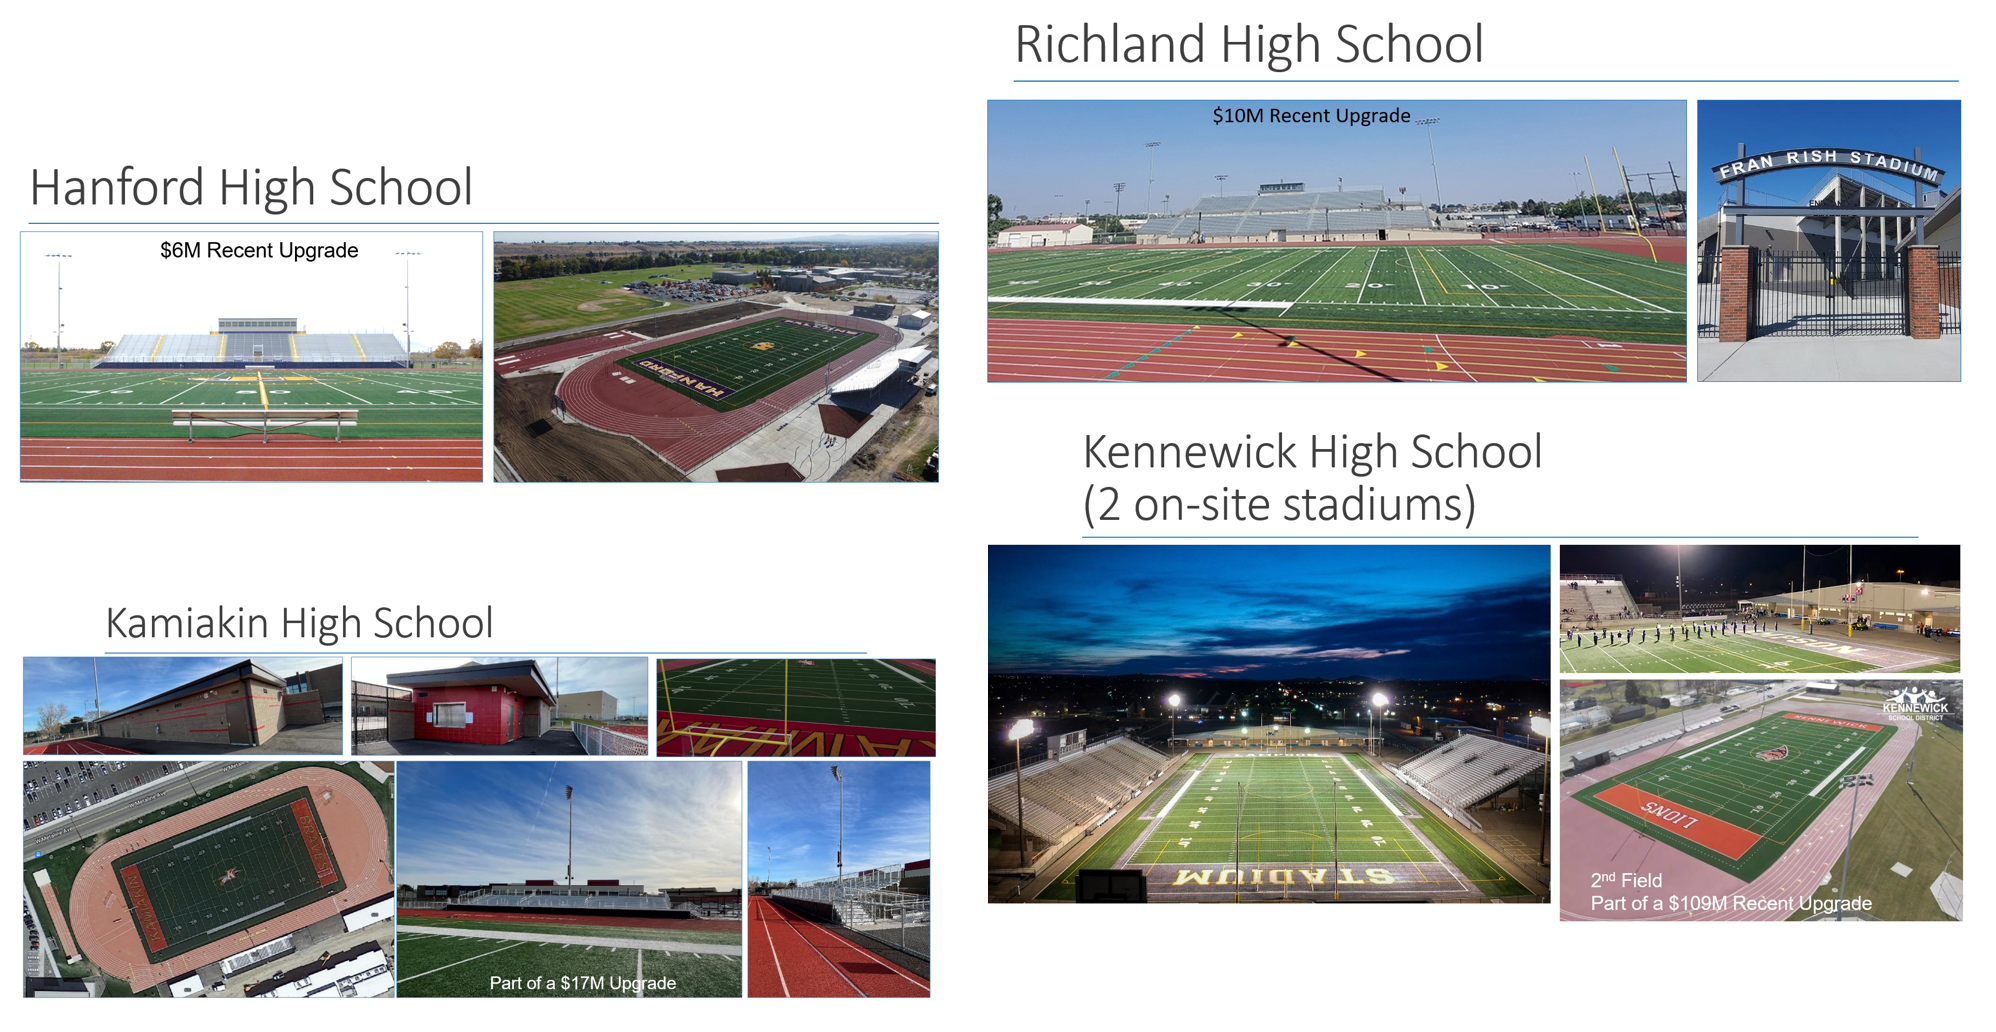
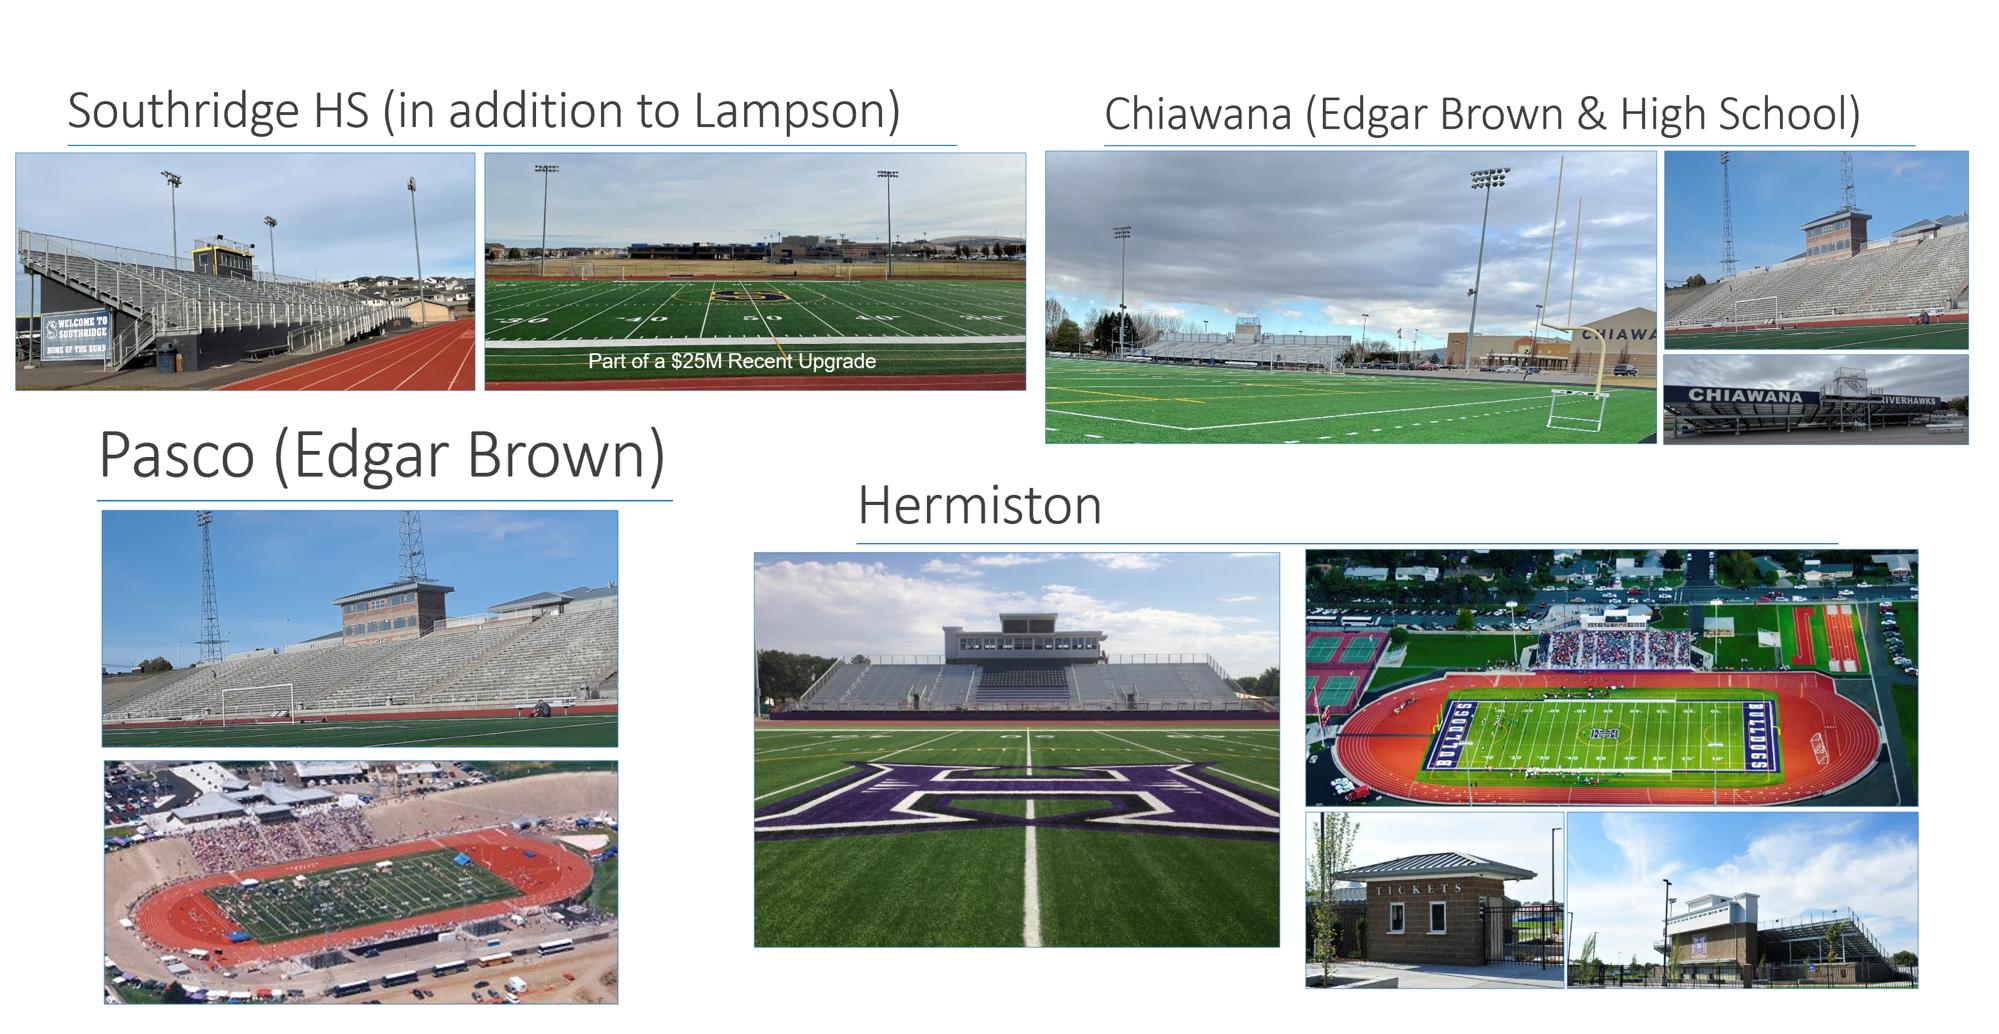
Multi-Sport Facility Comparison
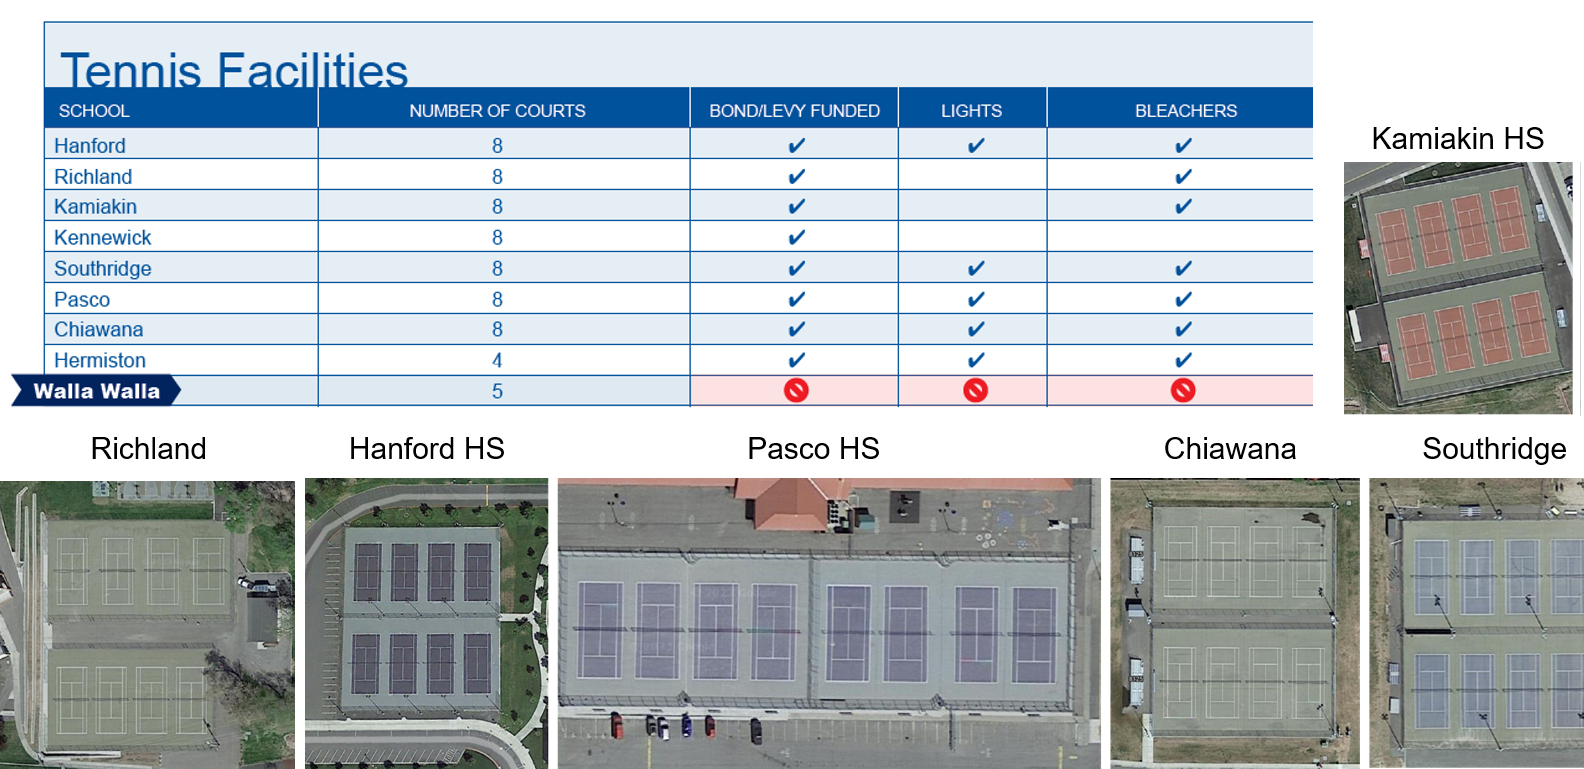
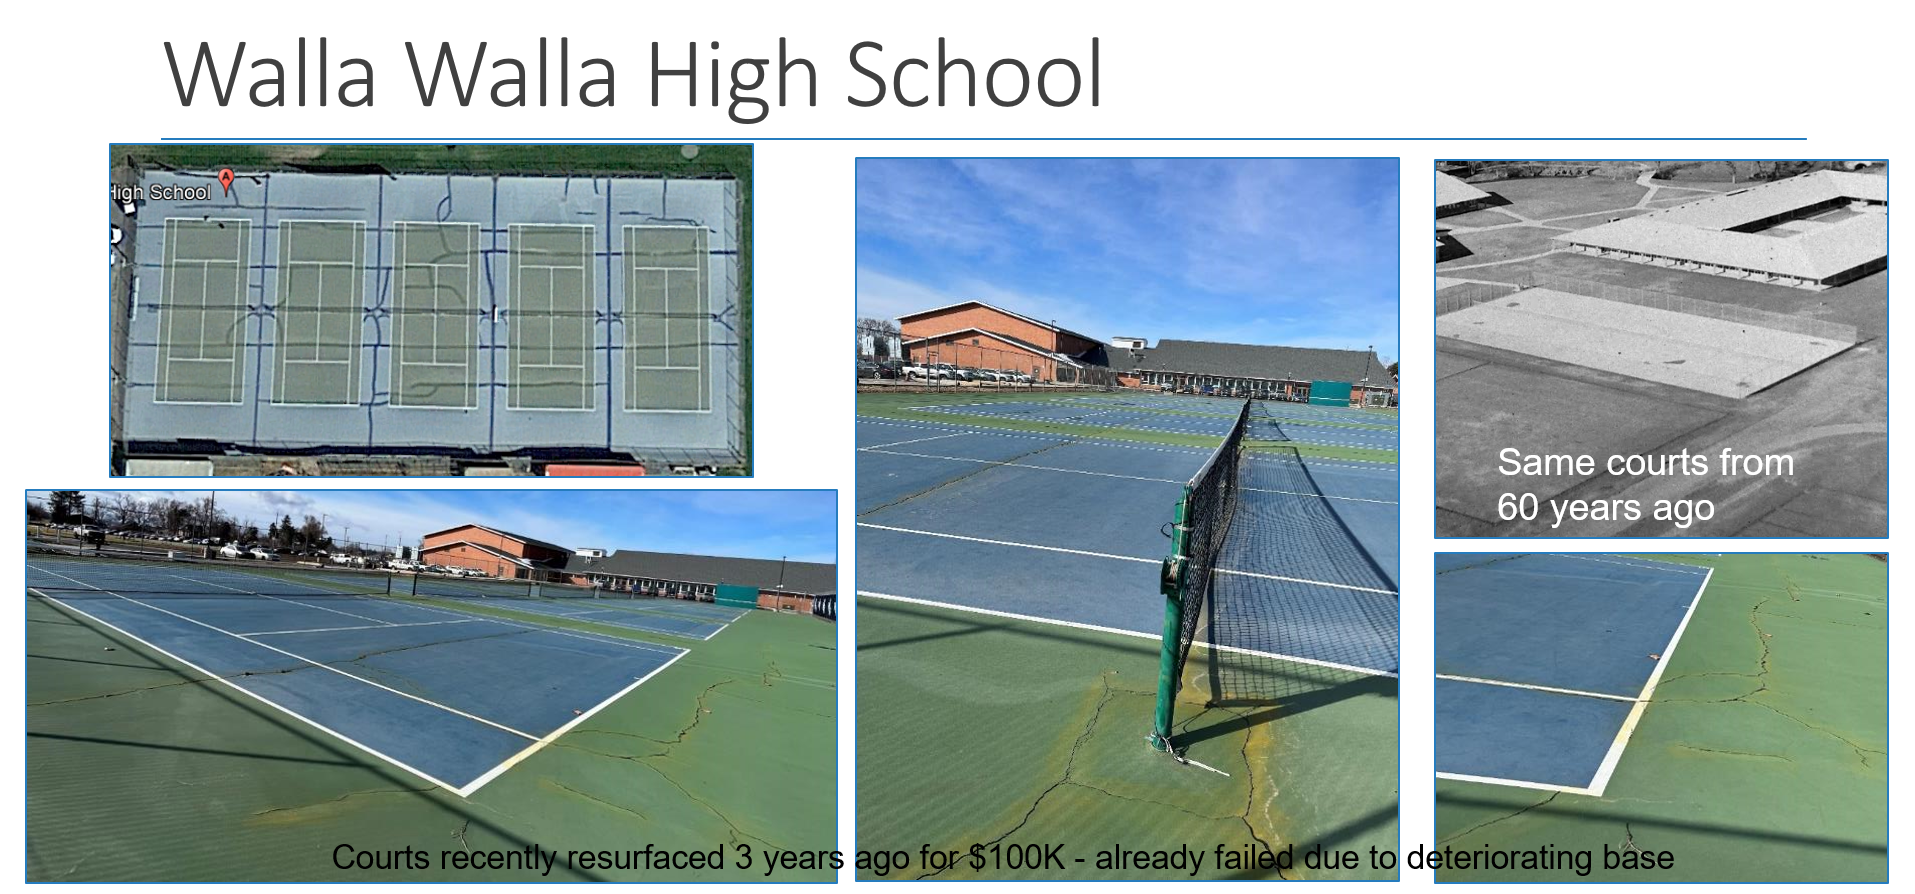
Tennis Facility Comparison
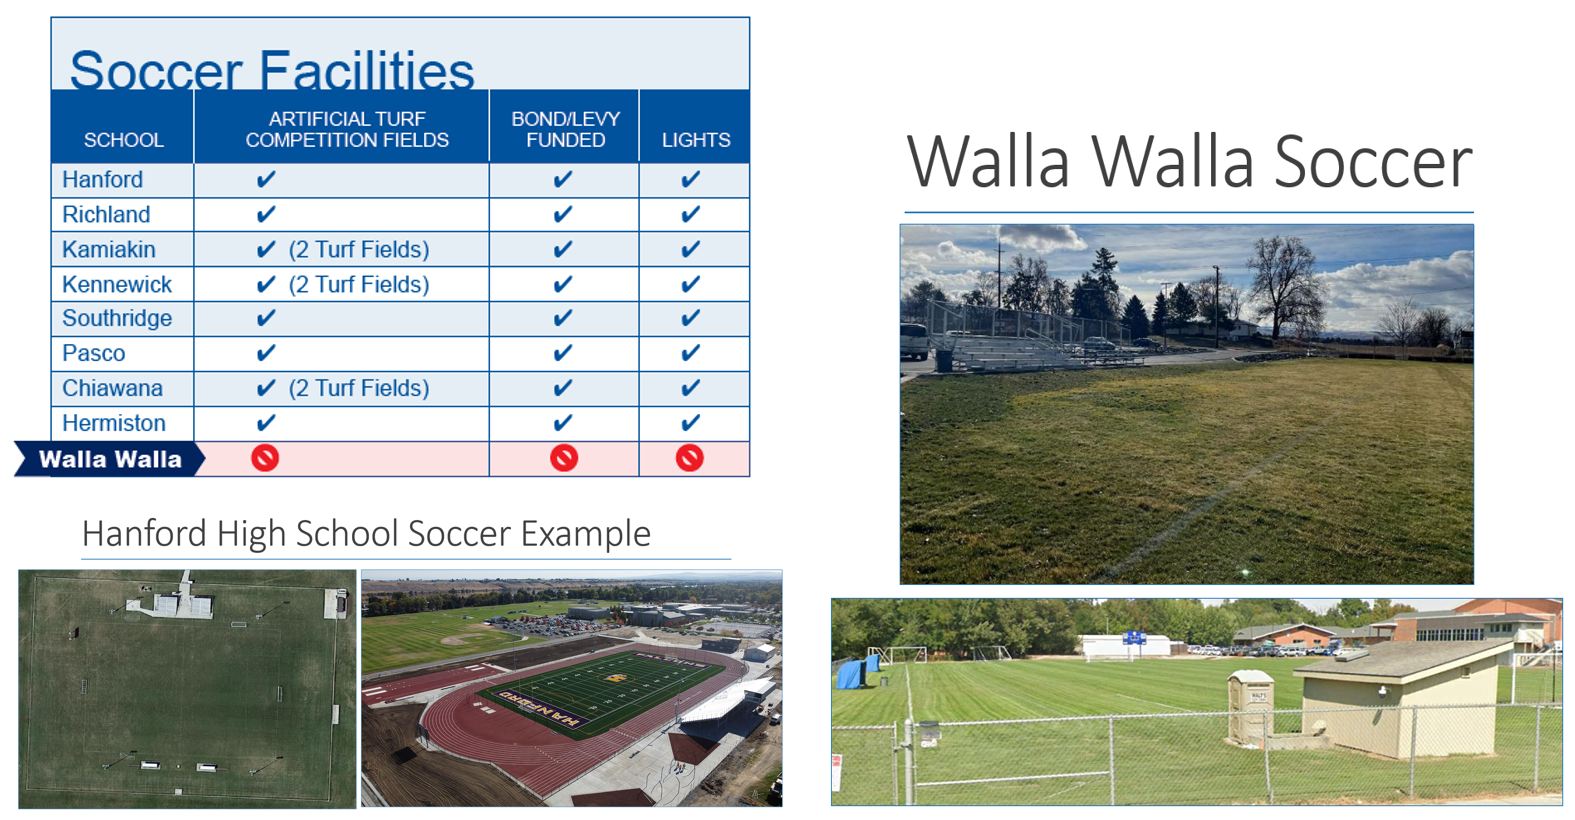
Soccer Facility Comparison
Track Facility Comparison
Baseball/Softball Lights Comparison
Middle School Track Comparison
JROTC Raider Course
What Has Our Historical Bond/Capital Rate Been?
Prior to 2017, Walla Walla residents experienced a bond/capital tax rate that fluctuated between $1.23 to $1.30 per $1,000. When the replacement school bond was passed in 2018, voters were promised that the rate would not increase. Since 2018, bond rates have actually fallen by nearly $.40. The proposed "Comparable Plan" would temporarily increase rates back to historical levels for a short, six-year term.
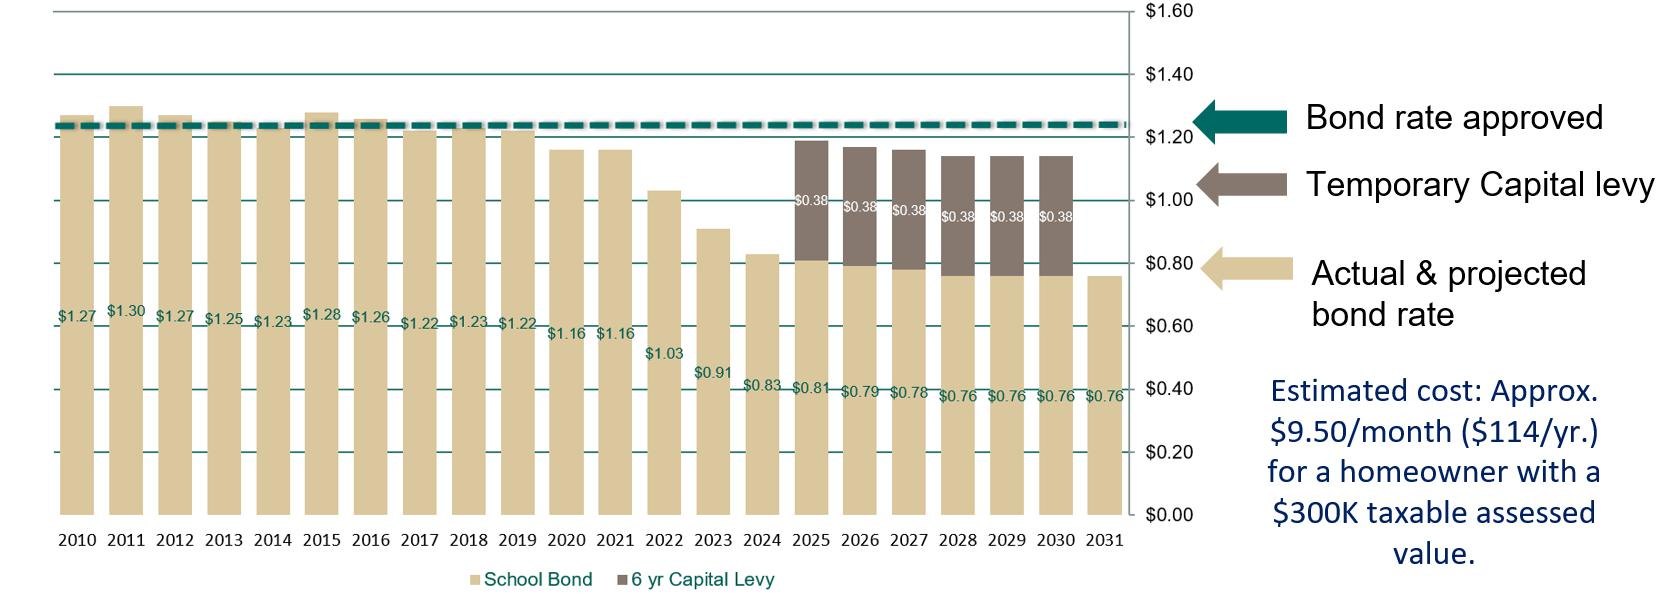
How Much Will This Cost?
One question the district has received is how much will the committee’s proposed recommendations cost property owners. The “Comparable Plan” is 38 cents per $1,000 & the “Comprehensive Plan” is 49 cents per $1,000. So what does that mean? For example, the “Comparable Plan” is $38 per year for every $100,000 of assessed value. So for a home assessed at $300,000 the annual cost would be $114 per year or $9.50 per month through the six year capital levy time frame.
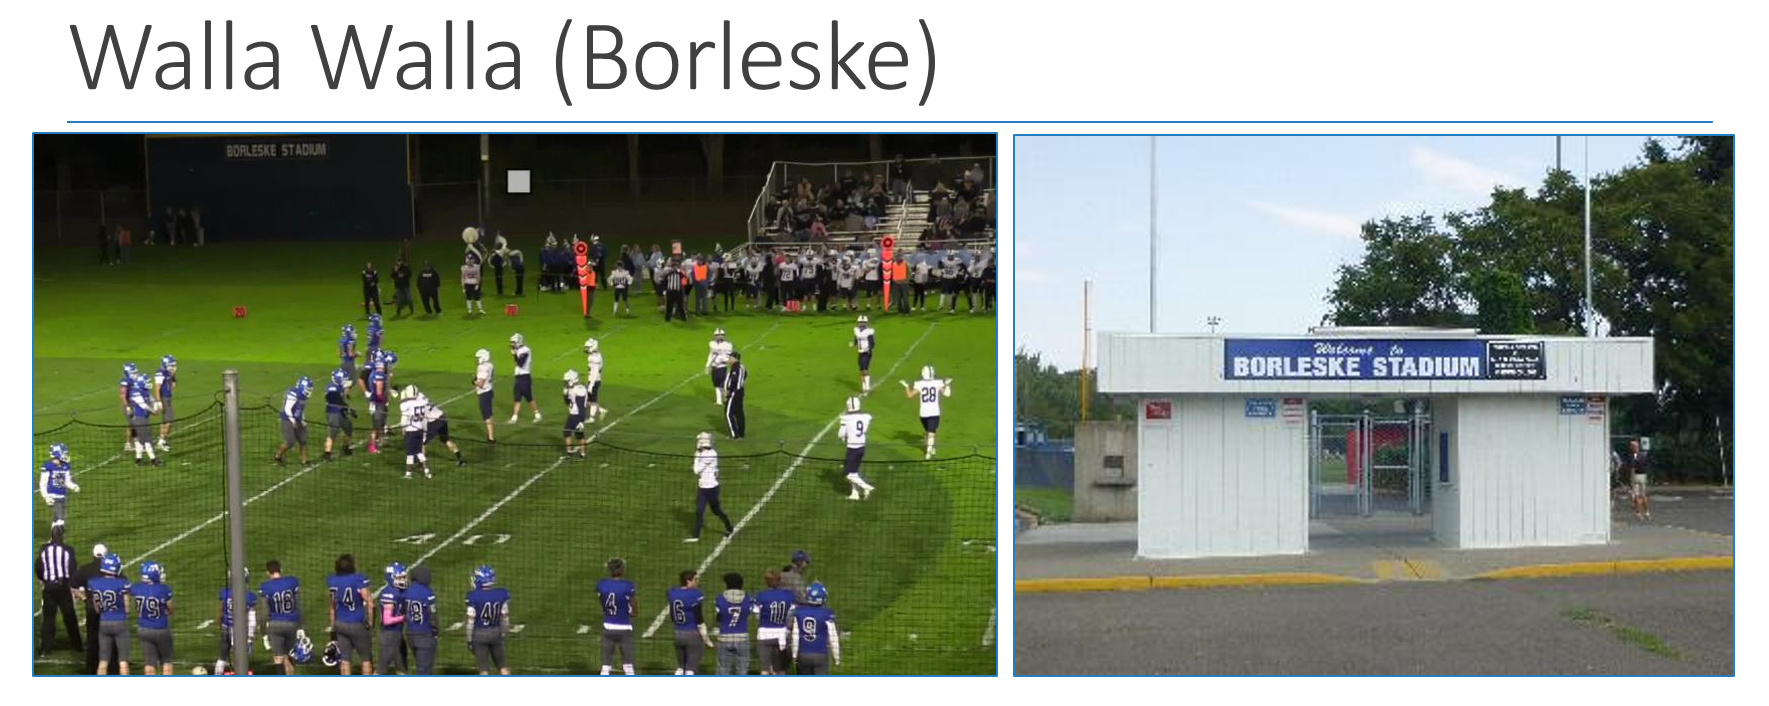
Recommend a Transition Away From Borleske
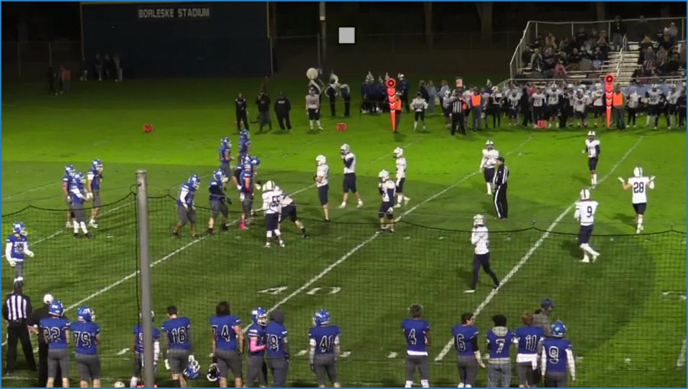 The Committee reached unanimous consensus that it is time for the district to transition away from Borleske. The Committee found that while Borleske has served the district’s needs for nearly a century (1926), it is long overdue to transition away from the facility in order to address a much needed multi-sport/multi-use complex approach - where football, soccer, track, marching band and other youth/community activities can access and participate year round on an artificial turf field in order to maximize utilization and participation.
They also found that:
- As baseball site improvements continue to be made, it becomes more problematic and prohibitive to convert the baseball stadium into a football field for 5 varsity games per year. This transition costs the district $100,000 per year in fees and associated costs ($5,000 a quarter).
- The locker rooms were condemned nearly 50 years ago so teams are forced to change in busses, batting cages and a small community meeting room.
- The field is not accessible for practice or other athletic performances as overuse would damage the grass for baseball.
- The spectator experience has become compromised as required baseball safety enhancements are made.
- Spectator restrooms, concessions and ADA access is limited.
Is There Sufficient Parking and What About Traffic?
It is important to remember that, other than the five varsity football games that are currently hosted at Borleske, all of the events currently proposed at the multi-sport stadium already take place on the site. For example, boys and girls soccer games and track events already occur at WaHi. As it relates to the five football games that would be hosted on site, attendance at those events are similar in numbers to students and fans who attend basketball games.
Specifically related to parking, as was recommended by the Long Range Facility Planning Committee, the district added 100 additional parking stalls with the new construction, totaling 733 spots. This represents over two times the number of stalls required for the high school campus (362), and well in excess of the 312 stalls required for the proposed 2,500 seat stadium.
What are low-spill/low-glare field lights?
The district is taking every consideration to minimize any impact on nearby residents. This includes incorporating state-of-the-art, low-spill/low-glare lights at the Murr baseball and softball complex, as well as the main campus (e.g. multi-sport stadium). Below are images that highlight the Ephesus Lumasport 8 LED system with glare and cutoff control that eliminates light spillage and glare.
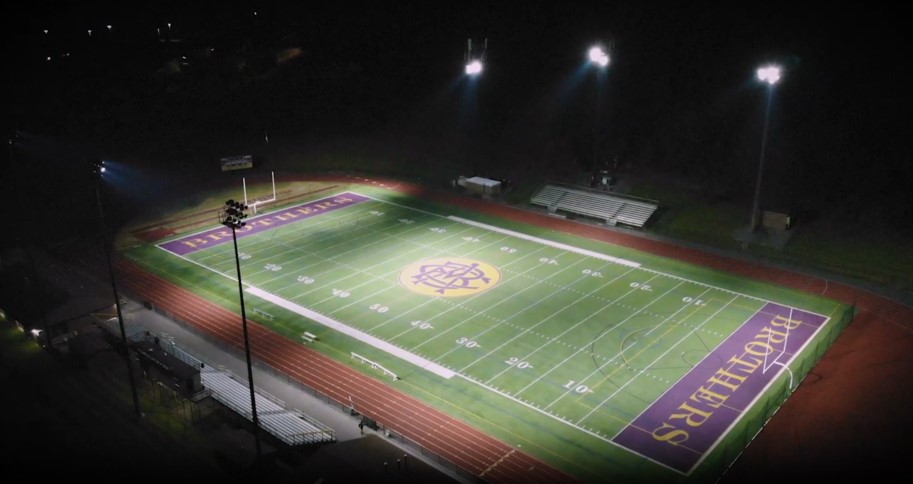
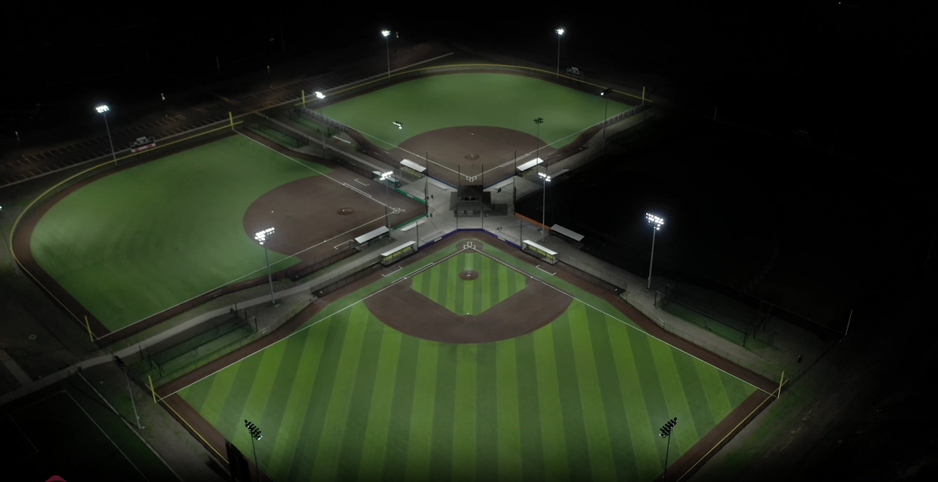
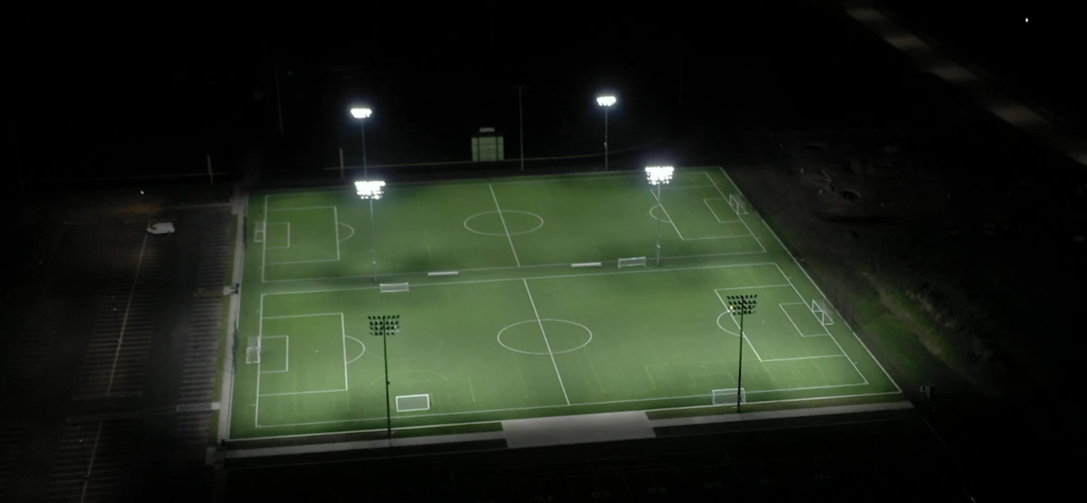
Below is a video that highlights the Ephesus Lumasport 8 LED system.
Economic Impact of a Multi-sport Facility
What Kind of Economic Impact Could a Multi-Sport Facility Bring to our Local Economy?
According to a study commissioned by ECONorwest in 2015, a multi-sport facility like what is being proposed could generate over $1.1M annually in local spending and labor income.
In 2015 ECONorthwest performed a comprehensive analysis on the economic impact that Hermiston School District brought to their community by hosting district events on their campuses. Among their findings, the report specifically analyzed the economic driver the district’s recently-unveiled Kennison Stadium played as it evaluated outside events hosted at the facility during the 2013-14 school year.
According to their report, visitors to the Hermiston area spent an average of $60.48 per day ($79.24 per day in current values adjusted for inflation).
| Commodity | Average |
|
Accommodations |
$16.40 |
| Food Service | $20.83 |
| Food Stores | $7.761 |
| Local Transportation and Gas | $10.62 |
| Arts, Entertainment and Recreation | $13.98 |
| Retail Sales | $9.80 |
| Total | $79.24 |
During the 2013-14 school year, the Kennison Stadium Complex hosted 20 outside events which included an estimated 1,618 participants and 7,780 spectators for a total of 9,398 attendee days, generating approximately three quarters of a million dollars in preliminary goods and service purchased at local community businesses.
According to the report, “The initial visitor spending leads to further economic activity as these dollars circulate within Umatilla County. This leads to what economists call the “multiplier effect.” Hermiston businesses and households re‑spend a portion of the income from the initial stimulus at other nearby businesses. This effect continues many times, causing the dollars to “multiply” within the local economy.”
| Spending Round | Output | Labor Income | Jobs |
| First | $744,697 | $187,972 | 8 |
| Subsequent | $195,008 | $63,475 | 2 |
| Total | $939,705 | $251,447 | 10 |
Based on their data and calculations, the total economic impact resulting from visitor spending attributable to outside events hosted at Kennison Stadium in 2013-14 was estimated to be $1.1M in today’s dollars.
March 2023 Coach and Parent Presentation to the School Board
In March 2023 a comprehensive analysis of current facility amenities and research was presented to the Walla Walla School Board. Click here to download their full report. Below are video links to sections from the preliminary report.
Safety on New Generation Artificial Turf
Significant research has been performed over the last four decades related to injury prevention and tendencies between artificial turf and natural grass. While peer-reviewed research is available on this topic, many variables have been contemplated when analyzing published data for applicability to the district's circumstances.
The Committee and consultants found that:
- Most studies include data from older generation turfs (e.g. 2nd Generation and early 3rd Generation) commonly used from the 1980's to 2010's, which are void of significant safety improvements/technology such as G-Max pads and improved organic infills.
- Few studies compare safety and injury comparisons between traditional high school facilities and modern artificial turf.
- A majority of the studies focus on injury comparisons of professional and collegiate athletes when playing on professionally manicured natural grass vs artificial turf.
- Some of the research has been funded by artificial turf manufacturers which may necessitate independent verification to ascertain validity.
Taking into consideration these circumstances, in addition to the safety implications that would result in the deterioration of natural grass fields due to excessive use, the Committee unanimously concluded that high quality artificial turf surfaces were the most prudent choice. This similar determination has been made by the Washington State High Interscholastic Activities Association (WIAA), who steer playoff and post-season play to artificial turf in lieu of natural grass under most circumstances.
Is Artificial Turf Cost Effective?
The committee's unanimous recommendation to replace the two natural grass fields with artificial turf was based on many considerations, and cost was one of those factors. While longitudinal research has shown that a 1:1 replacement (artificial turf for grass) can be more expensive, even when taking into consideration savings on maintenance, care of grass, and up to 1 million gallons of water saved per field, it is far more cost effective when considering the ability to use/access the playing field.
If the varsity and jv fields on the WaHi campus were to remain natural grass, the multi-sport complex would not be accessible for both competitions and practices due to field over-use. The soccer, football, marching band, PE and community users would need to find another location to practice as the natural grass surface, with even the best of care, would not hold up to the 6 hours of use per day, in addition to weekly performances/competitions. If the field remained natural grass, the district would have to procure additional property offsite to install two additional additional practice fields. This cost, in addition to the challenging logistics of bussing, utilities, amenities and safety response, makes the installation of artificial turf at the JV and V fields more cost effective and prudent for our community.
Are "Forever Chemicals" in Modern Artificial Turf Fields?
WWPS is making evert attempt to source artificial turf where PFAS are not used as a component of the manufacturing process.
"Forever Chemicals," (per- and Polyfluoroalkyl Substances commonly referred to as PFAS), are man-made chemicals that have been used in industry and consumer products worldwide since the 1940s. They have been used to make nonstick cookware, water-repellent clothing, stain resistant fabrics and carpets, some cosmetics, some firefighting foams, and products that resist grease, water, and oil.
PFAS can be found in products such as:
- Some grease-resistant paper, fast food containers/wrappers, microwave popcorn bags, pizza boxes, and candy wrappers
- Stain resistant coatings used on carpets, upholstery, and other fabrics
- Water resistant clothing
- Cleaning products, personal care products (shampoo, dental floss) and cosmetics (nail polish, eye makeup)
- Paints, varnishes, and sealants (Source CDC.gov)